Find the one thing holding your organisation back.
Twenty-two statements. A calibrated read on fifteen signals. The single limiting factor, named — and your first move against it, this week.
No sign-up. Your read is on screen the moment you finish.
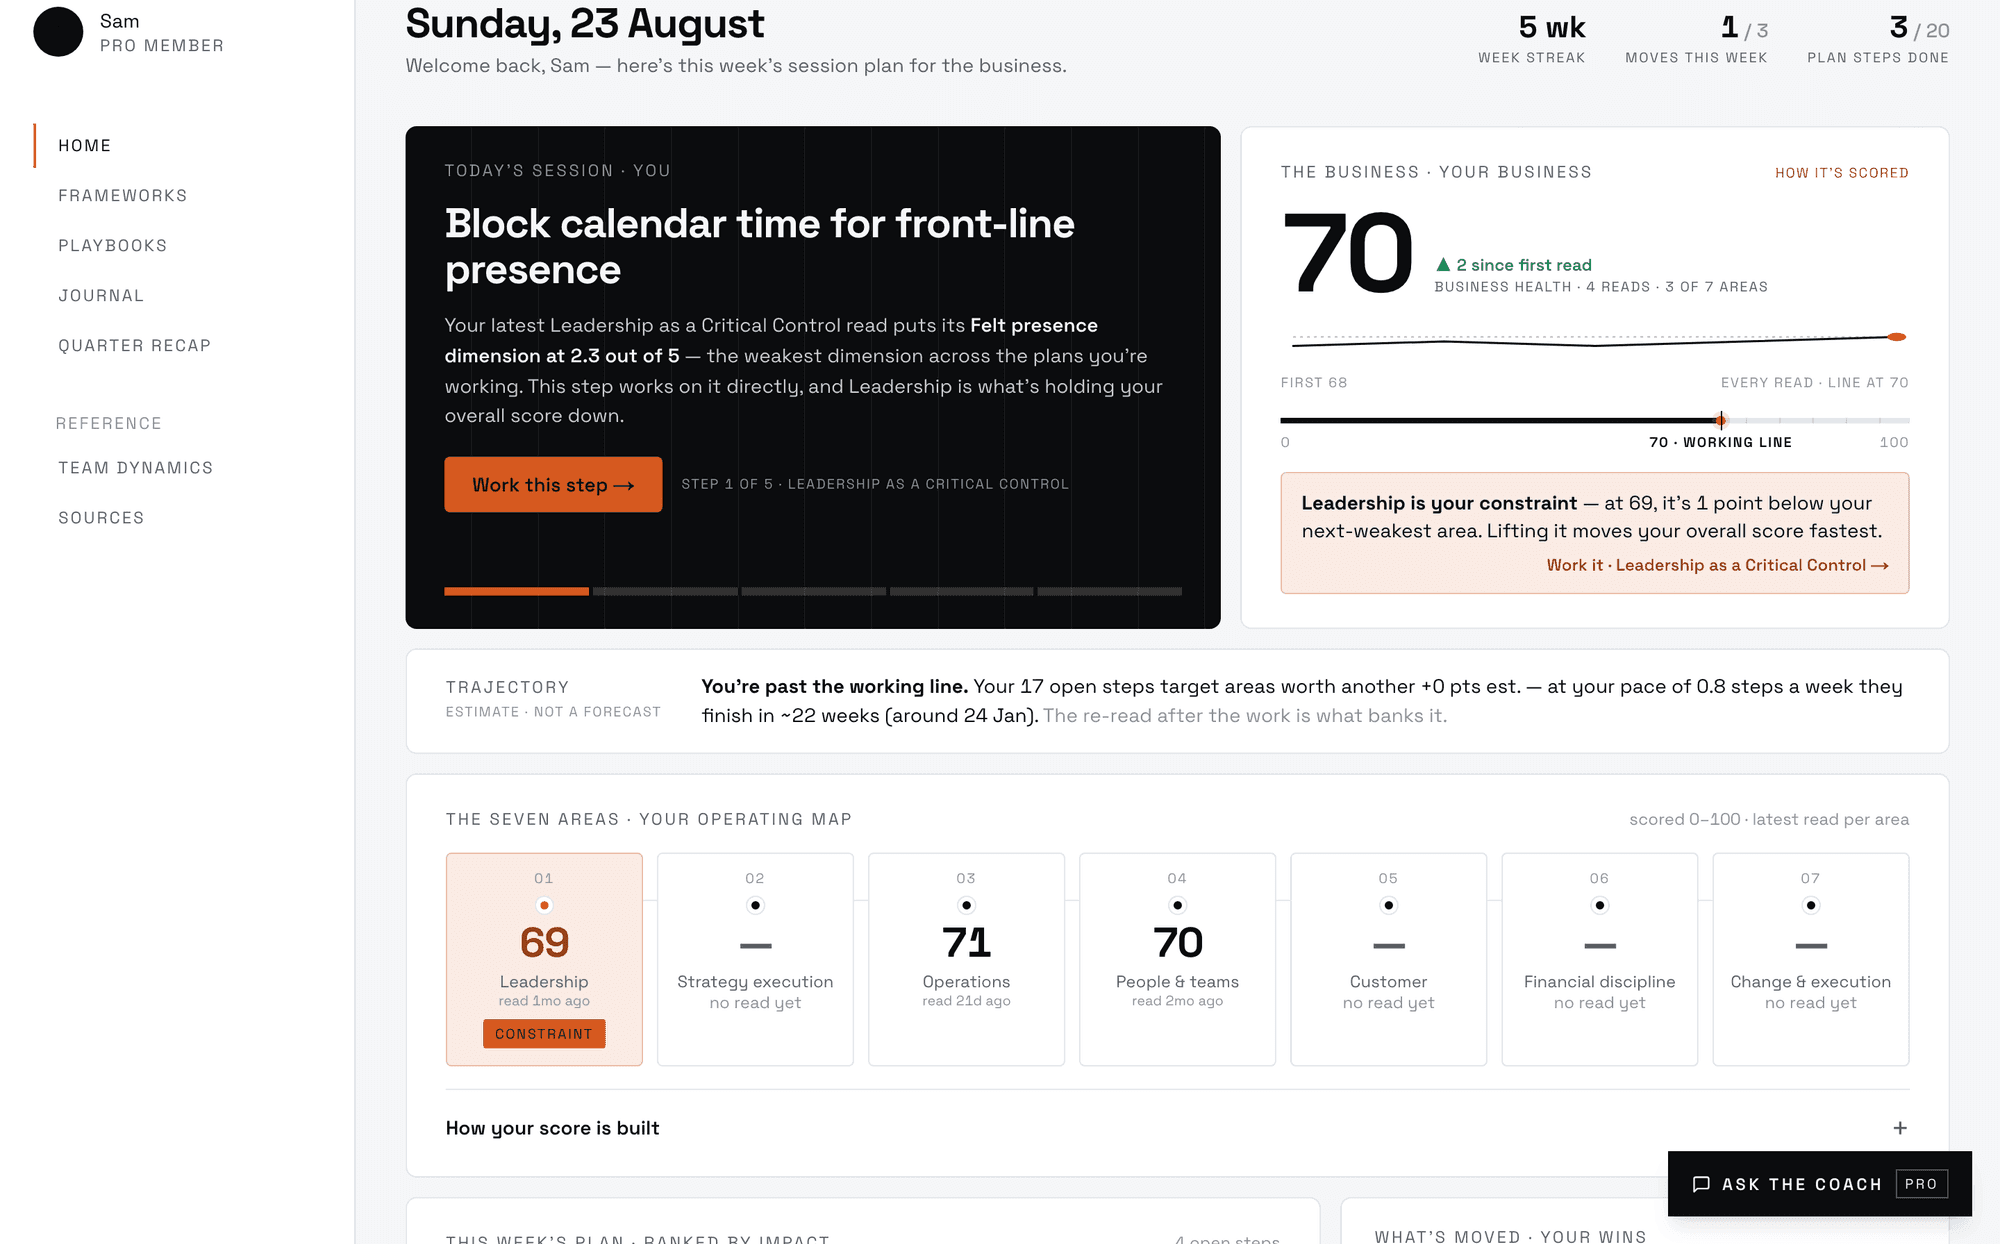
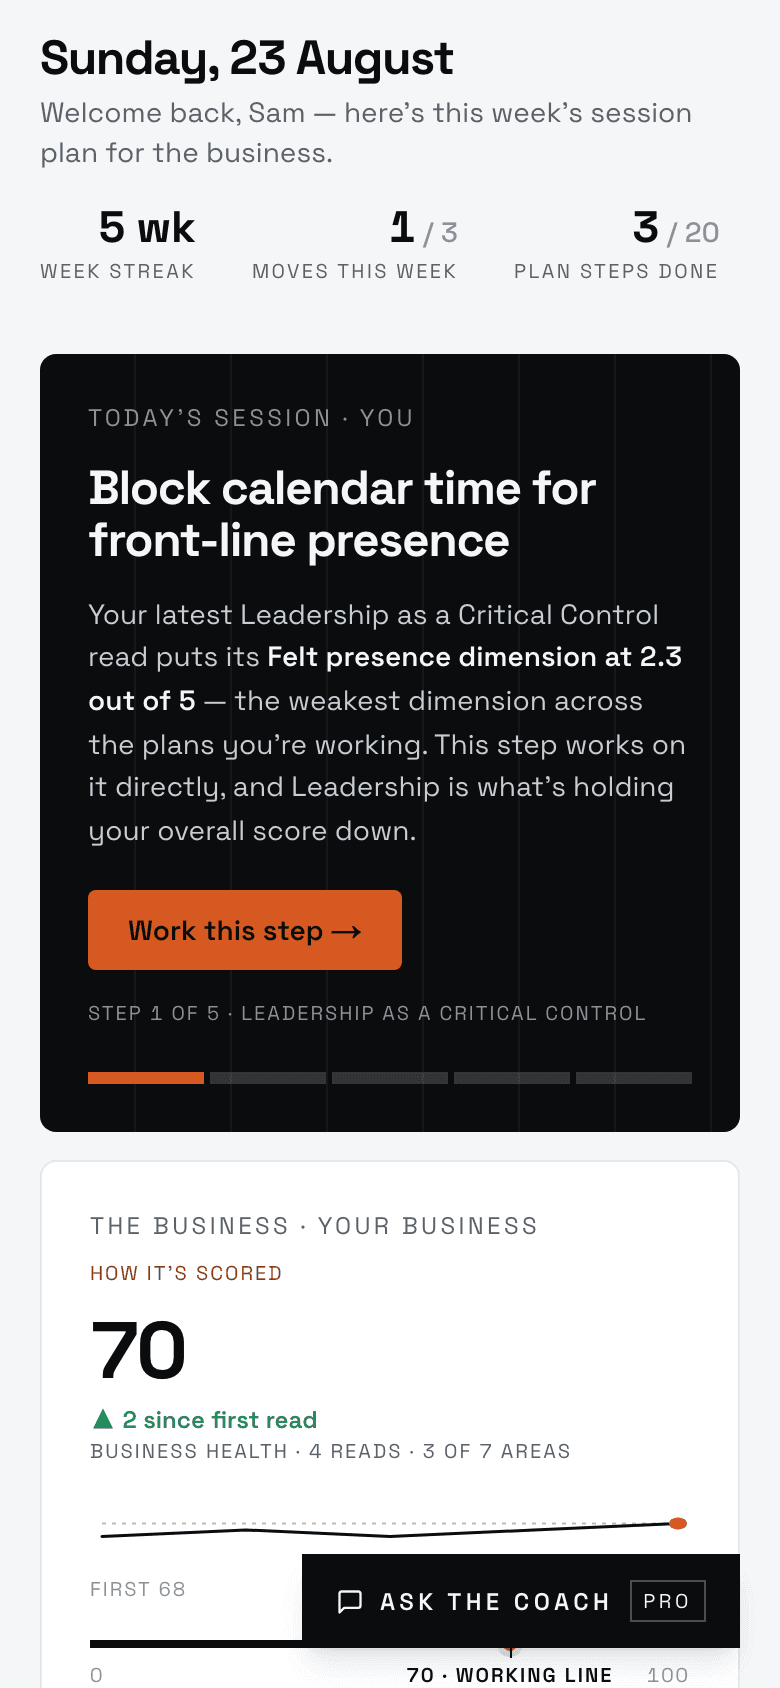
Your workspace after the diagnostic — real product screens, illustrative business.
Twelve minutes to a read. Thirty days to a shift.
The diagnostic and your read are free. An account is where the work happens — the full read, the benchmark and the plan.
Take the 12-minute diagnostic
Twenty-two statements about how your organisation actually runs — clarity first, then the operating system. Rate what you see, not what the strategy document says.
Get your read
Your overall score, the one limiting factor your answers converge on, and the first move against it — this week's work, named.
Work the plan
All fifteen signals scored, how you compare with the typical executive-led business, and a sequenced 30-day plan — with the Coach and every framework behind it. Cancel any time.
Re-read. See what moved.
Run it again and watch the limiting factor shift. The second read is the proof — and it tells you where to push next.
A precise read on what's actually limiting performance.
Twenty-two statements. Fifteen signals across strategic clarity and the operating system, on one calibrated scale. The read names your single limiting factor and the first move that shifts it — built on thirty years of senior-leader work.
8 of the 15 signals shown · the full read scores every one, against an indicative range from thirty years of executive-team reads.
Strategic clarity
7 signalsWhether the strategy is understood, owned and being executed the same way across the leadership team.
- Clarity of intent
- Translation into priorities
- Shared ownership
- Decision rights & role clarity
- Accountability & execution
- System alignment
- Sequencing & pace
The operating system
8 signalsWhether the business systems that deliver the strategy are holding — routinely, without heroics.
- Health, Safety, Environment & Community
- Market leadership
- Customer service excellence
- Supply chain excellence
- Manufacturing / operations excellence
- People & performance
- Knowledge & information
- Governance

The numbers leaders move when they work the right constraint.
1994–2012 · 12,000 people · 20 countries
Cement Australia
Cement Australia
CEO to supervisor groups
LTIFR / TRIFR — lost-time / total recordable injury frequency rate per million hours worked.
How the BlueScope turnaround happened →“The best program I have done — the rumours are true, this is the best course Holcim has to offer.”
Program participant · Holcim
Post-program feedback from leaders at BlueScope, Holcim, Cement Australia and other client organisations.